
Policy and Guidance Document Library
All policy, guidance and advice published by the Society and College of Radiographers.
Browse
Reports and Surveys
Browse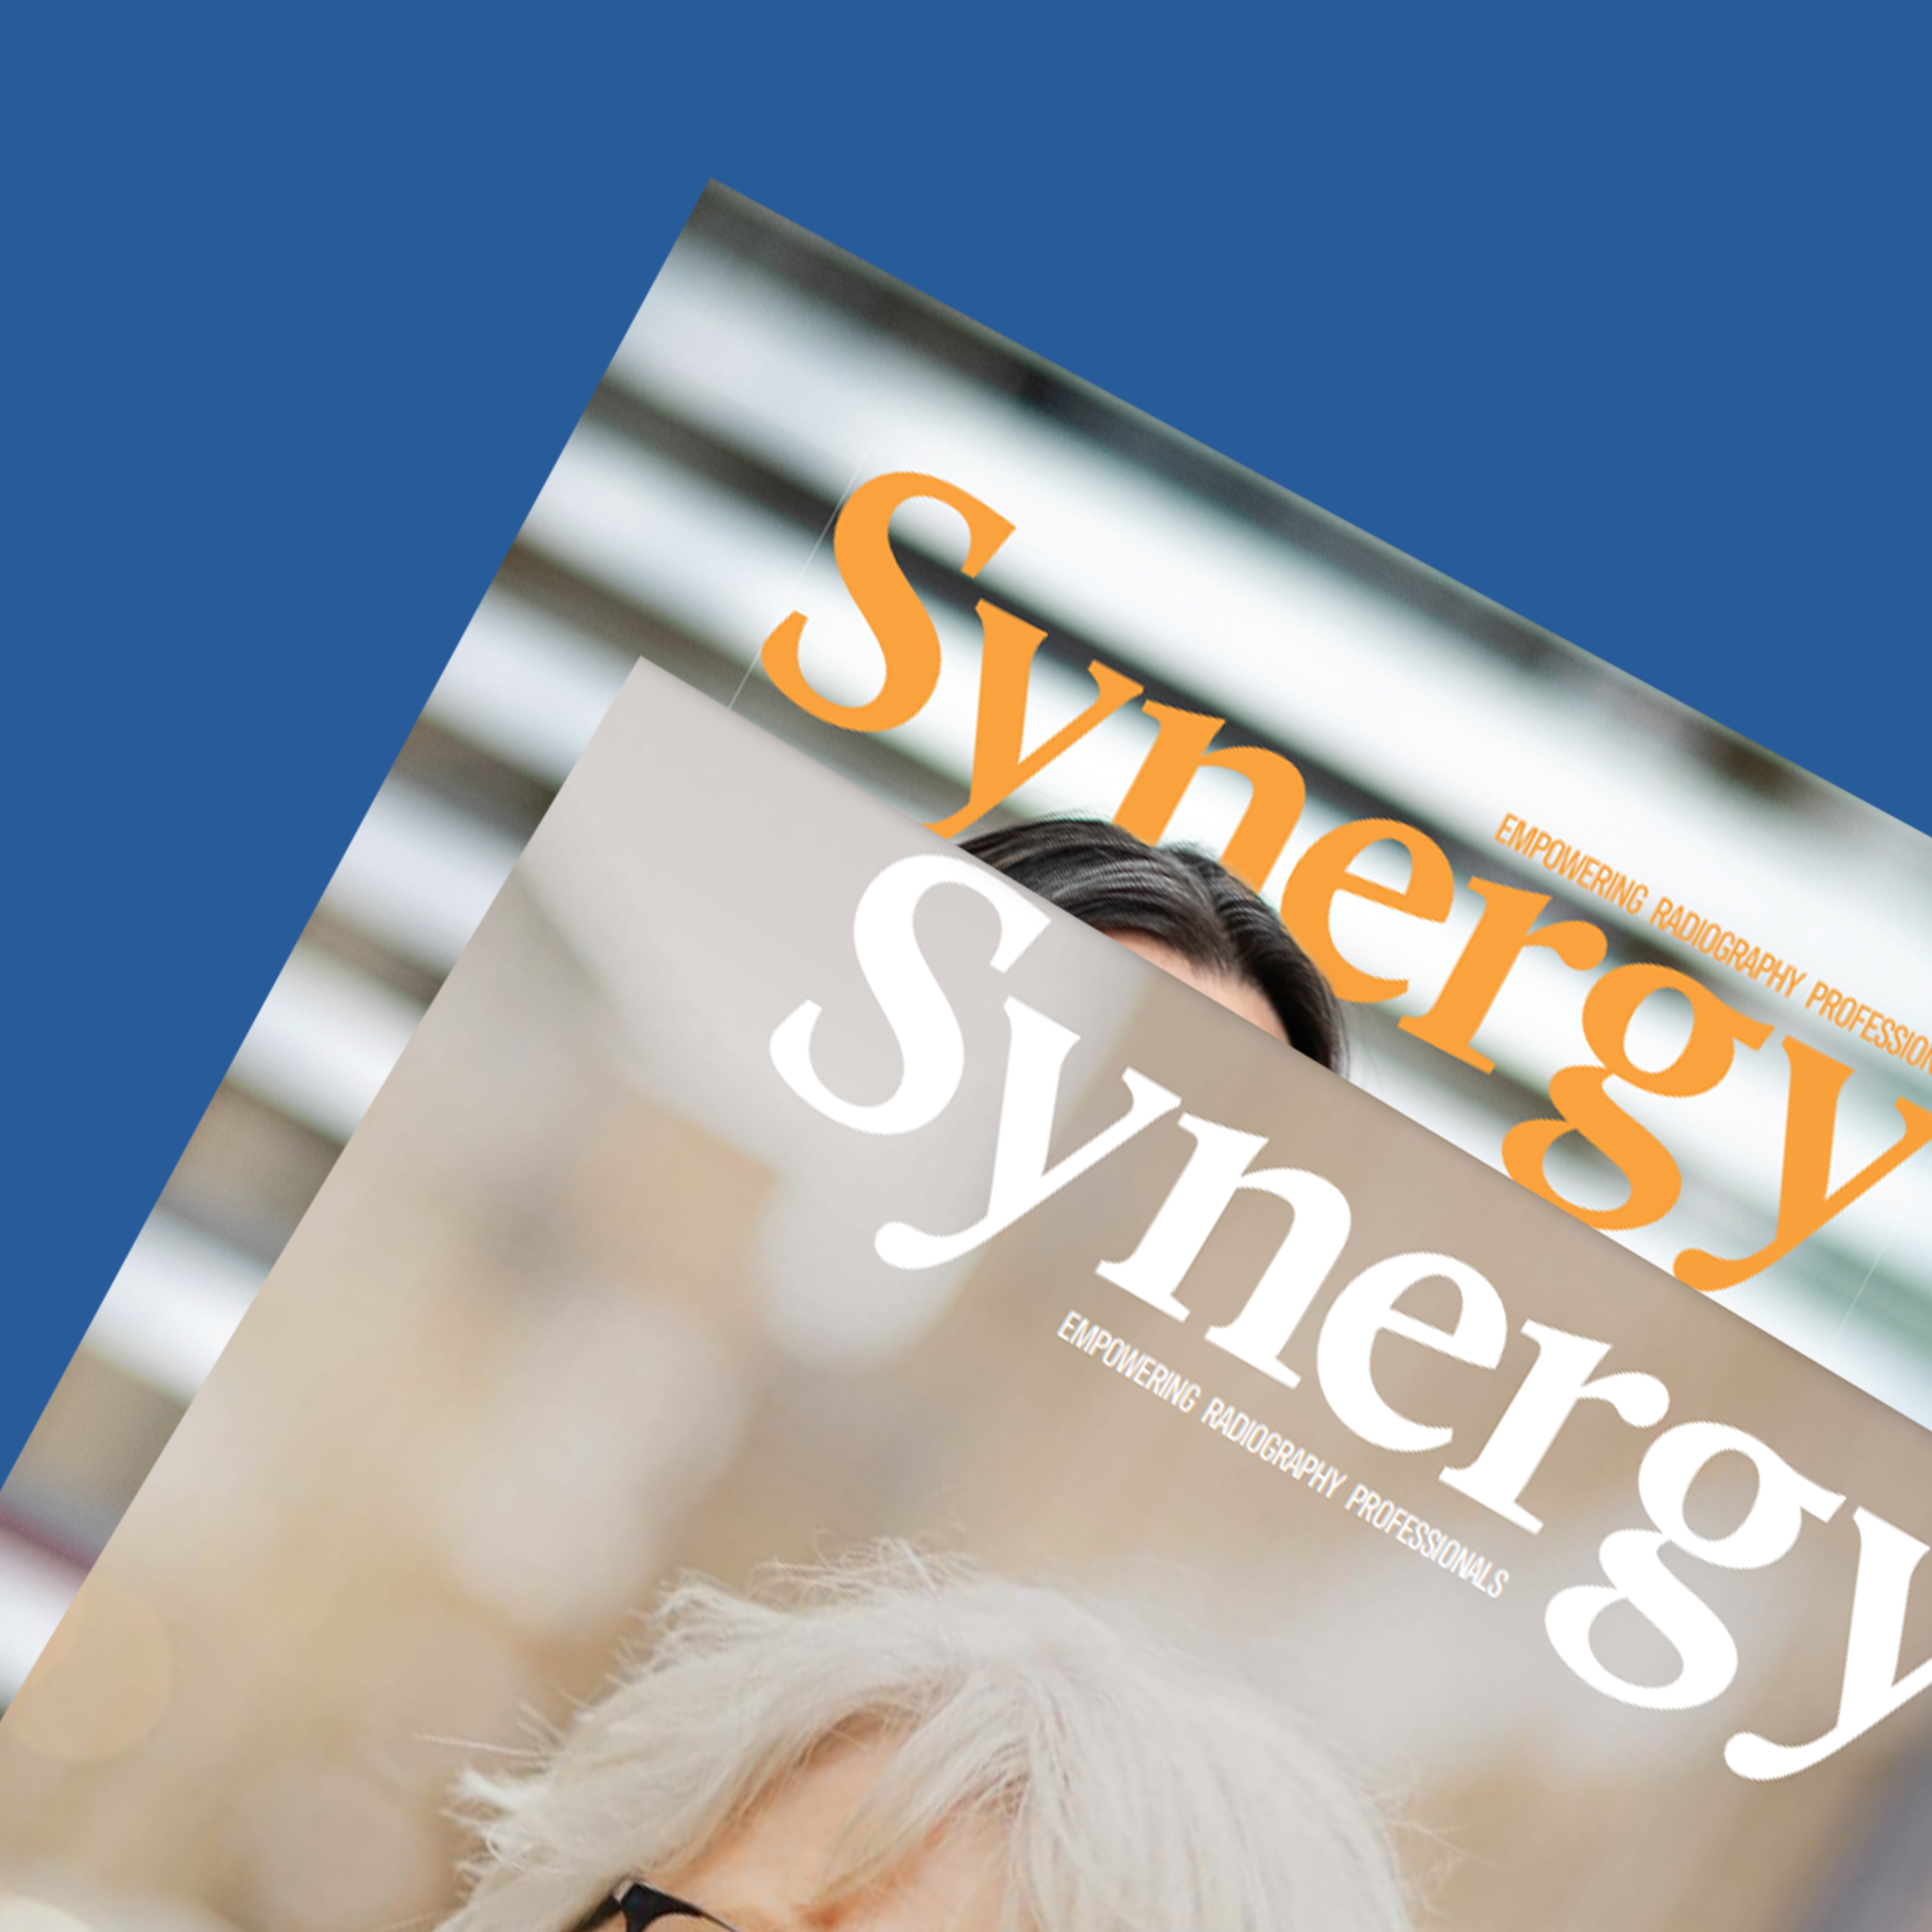
Synergy
Synergy is our monthly digital magazine for SoR members, celebrating and supporting radiographers in all aspects of their professional lives.
Browse
Archived guidance documents
Archived Documents - Please ensure you go to our policy and guidance library for current guidance
Browse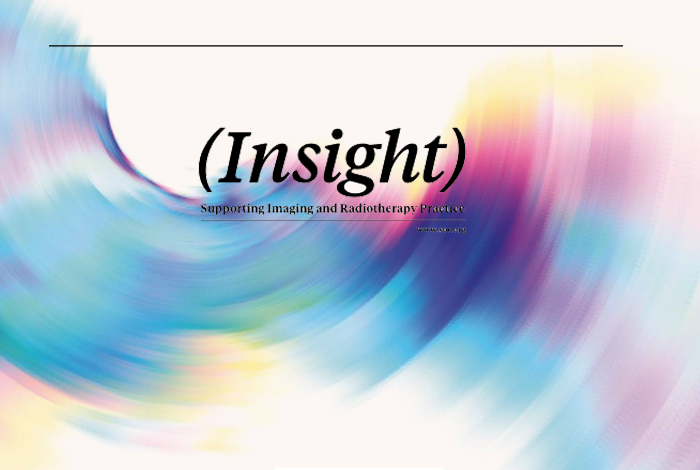
Insight magazine
Our quarterly radiography research and CPD magazine. Submit your work at sor.org/insightauthor
Browse
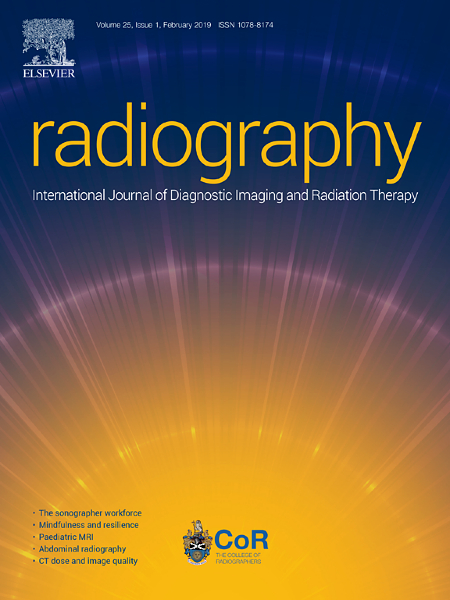
Radiography
An international, peer-reviewed journal of diagnostic imaging and radiation therapy.
Browse
Imaging & Oncology
An annual title published to coincide with the United Kingdom Imaging and Oncology Congress
Browse